Newsletter Article
TECHNICAL DEEP DIVE: Engineering Decision-Ready Intelligence
Part of the Data Advantage Newsletter Series
Make sure you subscribe!

From event correlation to governed intervention and outcome feedback: a reference architecture for data, analytics and platform teams.

The earlier articles in this series described what a decision-ready alert looks like from the recipient’s side: it explains what changed, why it matters, what is contributing, how much time remains, what can be done, who should act and how success will be judged.
This article covers the other side. It is written for the data engineers, analytics leads and architects who have to build that experience reliably, at operational latency, across systems that were never designed to agree with one another.
The central argument is simple. Producing a meaningful AI alert is a data-engineering, decision-design and governance problem as much as a modelling one. The model is one component. The system around it has to correlate events correctly, establish baselines that reflect how the operation actually behaves, rank conditions by what is at stake, propose only actions that are feasible and permitted, and record what happened next so the whole system can learn.
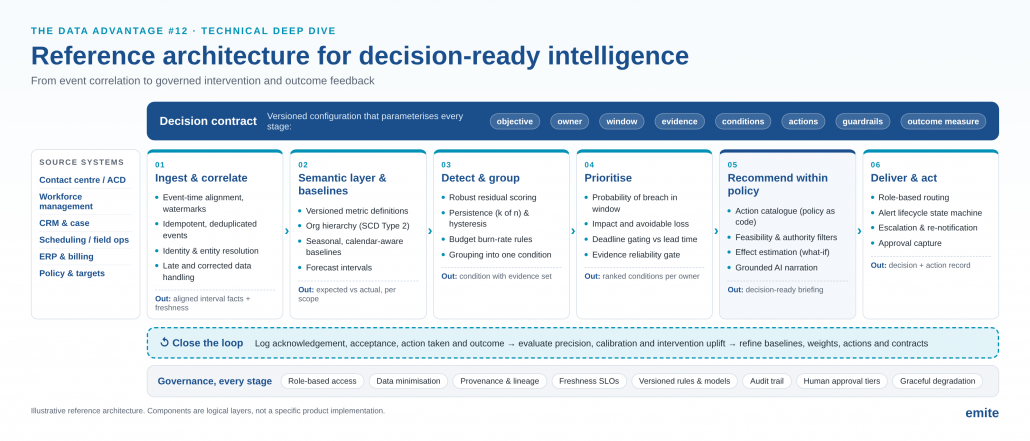
The sections below follow the architecture in Figure 1, from the decision contract through to governance, with the design decisions, failure modes and implementation patterns that matter in practice.
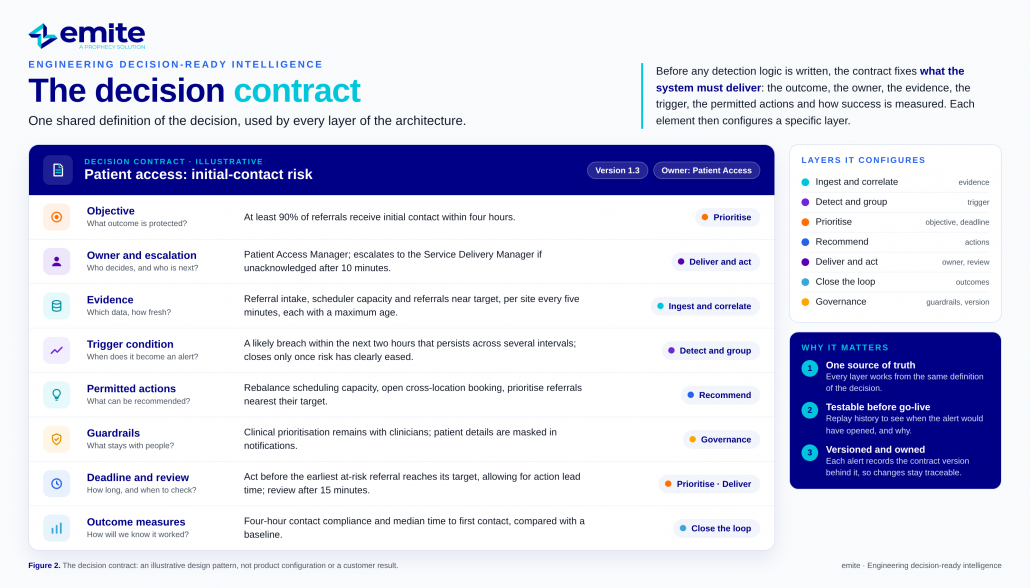
Most alerting systems begin with detection logic. Decision-ready systems begin with a specification of the decision being supported, which we call a decision contract.
A decision contract is a versioned, machine-readable definition of the conditions, evidence, responsibilities and permissible interventions associated with one operational decision. It plays the same role for an alert that an interface definition plays for an API: it fixes what the system must deliver before anyone decides how.
Three properties make the contract useful in engineering terms:
Writing the contract is also where many design problems surface early. If nobody can name the decision owner, or no permitted actions exist, the condition is a candidate for a dashboard or periodic review instead.
Decision-ready intelligence depends on combining signals from systems with different identifiers, clocks, latencies and business definitions. Most of the hard engineering in this domain sits here, and most of the misleading alerts originate here.
Event time, not processing time
An interval of contact centre data and an interval of workforce data should be joined on when things happened, not when they arrived. Sources deliver at different cadences: telephony events may stream in seconds, workforce adherence may batch every fifteen minutes, CRM updates may arrive out of order.
The standard pattern, formalised in the Dataflow Model (Akidau et al., 2015), is to window on event time and use watermarks to decide when a window is complete enough to evaluate. Each source declares an expected lateness; the correlation layer evaluates a window once every required source’s watermark has passed its end, or emits a partial evaluation explicitly flagged as incomplete.
For decision-ready alerting, the choice between waiting and evaluating early is itself a design parameter. A five-minute wait for complete data may be acceptable inside a two-hour decision window and unacceptable inside a fifteen-minute one. The decision contract’s planning horizon and evidence freshness limits make that trade-off explicit for each decision.
Late, corrected and duplicated events
Identity and entity resolution
A decision-ready alert often needs to know that a queue in the ACD, a skill group in workforce management and a service line in CRM refer to the same operational entity. Resolve this explicitly with a maintained mapping, deterministic keys where available, and documented survivorship rules where sources disagree.
Organisational structure changes over time: queues are reassigned to teams, sites open and close, skills are renamed. Model these hierarchies as slowly changing dimensions (Type 2), so that a historical baseline for “Team A” reflects Team A as it was then, not as it is now.

Freshness and provenance
Every evidence item that reaches an alert should carry its source, its as-of time and its completeness for the evaluated window. That metadata does two jobs: it lets the recipient judge how far to rely on the alert, and it lets the pipeline refuse to make a claim it cannot support. If a required source exceeds its freshness limit, the correct behaviour is to degrade gracefully, for example by falling back to a simple threshold alert that is labelled as such, rather than producing a confident briefing on stale data.
A versioned semantic layer
Before anything can be compared with “normal”, the organisation needs agreed definitions of the measures involved. Service level, handling time, contact compliance and capacity are routinely calculated differently in different systems and teams. A semantic layer that holds versioned metric definitions, with the formula, filters, grain and owner of each, is the foundation for both consistent reporting and trustworthy alerting.
Gartner’s 2025 data and analytics predictions point the same way, highlighting that organisations focusing on semantics in AI-ready data help AI agents operate more effectively and support faster decision-making. In practice, every alert should record the metric versions it used.
Fixed thresholds where they belong
Where an explicit limit defines the condition (a contractual service level, a regulatory boundary, a system outage), a fixed threshold is correct and should stay. Contextual baselines are for conditions whose significance depends on time, season and circumstance.
Contextual baselines
Operational metrics in service environments typically show strong intraday, weekly and annual seasonality, plus calendar effects such as public holidays, billing cycles and campaigns. Three baseline strategies cover most needs:
| Approach | How it works | Strengths | Watch-outs |
| Seasonal profile | Median of the same interval-of-week over the last N comparable weeks, excluding flagged anomalies | Simple, explainable, robust | Slow to adapt to trend; needs a holiday calendar |
| Decomposition | Seasonal-trend decomposition (STL) separates the trend, the seasonal pattern and the remainder; the remainder shows what is genuinely unusual | Handles trend and multiple seasonal cycles well | The remainder still needs an outlier-resistant measure |
| Forecast with a range | Forecast the expected value together with a range of likely outcomes, using calendar features such as day of week and public holidays | A natural fit for “will we breach?” questions | Check that the stated ranges match what actually happens |

Whichever approach is used, measure how far the current value sits from its baseline in a way that resists outliers, so a handful of unusual past days do not distort what counts as unusual. Median-based measures of spread are a common choice: they are easy to explain and behave well with the uneven, spiky patterns typical of operational data.
Two further practices make baselines operationally sound. Maintain an explicit calendar of known events (public holidays, outage notices, marketing campaigns) and either condition the baseline on them or suppress alerts during them by design. And exclude past anomalous periods when building baselines, so that last month’s incident does not quietly redefine normal.
Persistence and hysteresis
A single interval above a threshold is rarely enough to justify interrupting someone. Two simple mechanisms remove most flapping:
Budget burn rates
Many operational targets are defined over a period: 90% of referrals contacted within four hours across a day, or 80% of calls answered within 20 seconds across a week. For these, the site reliability engineering practice of burn-rate alerting translates well. Google’s SRE Workbook describes alerting on the rate at which an error budget is being consumed, using multiple windows so that fast, severe burns and slow, sustained burns are both caught.
The operational equivalent is to treat the allowable shortfall against a target as a budget. If a day’s target permits 10% of referrals to miss the four-hour window, then a period in which 30% are at risk is consuming that budget at three times the sustainable rate. Pairing a short window (fast detection) with a longer one (confirmation) gives early warning without excessive noise.
One condition, one alert
When an operation comes under pressure, many metrics move together. Without grouping, each produces its own notification. Group related signals into a single condition using:
Alert lifecycle
Model each condition as a state machine rather than a stream of messages. This keeps notification behaviour predictable and creates the audit trail needed for evaluation.

| State | Entered when | Behaviour |
| Candidate | Detection criteria first met | Not yet notified; persistence being confirmed |
| Open | Persistence and priority gates passed | Owner notified with briefing; escalation timer starts |
| Acknowledged | Owner confirms receipt | Escalation timer stops; re-notify only on material change |
| Actioned | An action is recorded or approved | Review timer starts, using the contract’s review time |
| Resolved | Close criteria met (with hysteresis) | Outcome capture scheduled |
| Expired / Suppressed | Deadline passed unactioned, or known event | Recorded with reason; feeds evaluation |
A technically significant anomaly and a business-critical event are not the same thing. Prioritisation is where the system decides which open conditions deserve a person’s attention first, and it is worth making the logic explicit.
Expected avoidable impact
A useful way to rank conditions is by the impact that timely action could plausibly avoid. Three questions combine to produce that ranking:
Conditions that score highly on all three rise to the top of each owner’s list.
Deadline gating
Time works as a gate as well as a weight. Compare the time remaining before the decision deadline with how long the fastest feasible action takes to have an effect:
Evidence reliability as a gate
Treat evidence quality as a gate rather than a multiplier. If required evidence is stale or incomplete beyond the contract’s tolerance, the condition should be labelled accordingly or held, rather than ranked lower and delivered anyway with an air of confidence.

In practice, prioritisation runs the same sequence for every open condition:
Two cautions apply. First, the weights and thresholds must be validated against the organisation’s objectives, risk tolerance and available capacity; they are policy choices as much as technical ones. Second, a model’s confidence that a condition will occur says nothing about whether a particular intervention will succeed. Prediction quality and intervention effectiveness are separate questions and need separate evidence.
Finally, cap attention explicitly. An “attention budget” per owner per shift (for example, no more than a set number of interrupting alerts) forces the ranking to do real work and protects the credibility of the alerts that do get through. The value of ranking is well illustrated by a deployed public-health monitoring system described at AAAI 2026, where replacing binary alerts with ranked anomaly review produced a 54-fold increase in reviewer efficiency compared with traditional alert-based methods in that setting.
The recommendation stage combines business rules, approved workflows, analytical estimates and, where useful, AI-generated explanation. The architecture should make it structurally difficult to present an unsupported conclusion as fact, or to recommend an action that is not permitted.
An action catalogue, expressed as policy
Define each permissible intervention once, in a catalogue that the recommendation engine reads. Each action carries its preconditions, constraints, authority and expected effect model:
| What each entry defines | Illustrative example: rebalance capacity |
| Purpose | Temporarily move skilled staff from a lower-pressure queue |
| Preconditions | The donor queue has spare capacity, and the staff hold the skills the target queue needs |
| Constraints | The donor queue must stay within its own target; the move lasts no more than an hour |
| Lead time | Takes effect within about five minutes |
| Reversibility | Fully reversible |
| Approval | Workforce Manager |
| Effect estimate | A staffing model estimates how service level will respond |
The engine then follows a fixed pipeline: generate candidate actions from the contract, filter by preconditions and the recipient’s authority, estimate the effect of each remaining candidate, rank, and present the top one to three options with their trade-offs.
Estimating effect
Effect estimation should use the most defensible model available for the domain. In contact centre staffing, queueing models such as Erlang C are a well-established way to estimate how service level responds to changes in staffing for a given arrival rate and handling time. In other domains, the effect model may be a simple capacity calculation, a historical uplift estimate from similar past interventions, or a simulation. Whatever the method, the recommendation should state the expected effect as an estimate, with its basis.
Enforce the separation in the design
Presenting facts and inferences differently is a writing discipline at the front end. Behind the scenes, it should be a design rule. Treat each briefing as a structured set of distinct sections, each with its own check, so an inference cannot reach the recipient dressed as a fact:
| Briefing section | Populated by | Rule it must pass |
| Observed facts | Correlation layer, from connected systems | Every value carries its source, metric version and the time it was last updated, within its freshness limit |
| Inferences | Analysis and attribution models | Must state its confidence and method, and can never appear among the facts |
| Options | Action catalogue, after feasibility and authority checks | Every action offered must be permitted for this recipient at this time |
| Approvals | Contract guardrails and policy | Any consequential action names an approver; human-only decisions are never automated |

Estimating effect
Effect estimation should use the most defensible model available for the domain. In contact centre staffing, queueing models such as Erlang C are a well-established way to estimate how service level responds to changes in staffing for a given arrival rate and handling time. In other domains, the effect model may be a simple capacity calculation, a historical uplift estimate from similar past interventions, or a simulation. Whatever the method, the recommendation should state the expected effect as an estimate, with its basis.
Enforce the separation in the design
Presenting facts and inferences differently is a writing discipline at the front end. Behind the scenes, it should be a design rule. Treat each briefing as a structured set of distinct sections, each with its own check, so an inference cannot reach the recipient dressed as a fact:
Grounded AI narration
Large language models are well suited to turning structured evidence into a clear, readable briefing. They should not be the source of the facts in it. A robust pattern is:
This keeps the language flexible while keeping the content verifiable, and it creates a clear audit trail from every sentence in an alert back to its data.
An alerting system that does not record what happened after each alert cannot tell whether it is helping. The feedback layer turns alerts into a dataset for continuous improvement.
For every alert, keep a simple decision record. Illustrated with the patient access example:
| What to record | Illustrative example |
| Contract and version | Patient access: initial-contact risk, version 1.3, with the metric definitions it used |
| When it opened, and why | 9:05 a.m.; breach judged likely (around three in four); ranked first for the owner |
| How fresh the evidence was | Referral intake updated 9:03; scheduling capacity updated 8:58 |
| Options presented | Rebalance capacity; cross-location booking |
| The human response | Acknowledged at 9:07; first option accepted with a modification |
| Action taken | Two trained staff reassigned at 9:15 |
| Resolution and outcome | Resolved 9:52; four-hour contact compliance of 91% against an expected 83% |
Metrics for each layer
Business-facing measures such as time to intervention and the outcome being protected are defined in each decision contract. Alongside them, the engineering team needs metrics that show which layer is working and which needs attention:
| Layer | What to measure | What it tells you |
| Detection | The share of opened alerts that led to an action, by contract version | Whether baselines, persistence and hysteresis are well tuned |
| Ranking | The share of each owner’s highest-ranked conditions that were acted on in a shift | Whether prioritisation is spending limited attention well |
| Prediction | How closely stated likelihoods match what actually happened, measured on alerts where no action was taken | Whether the forecasts can be trusted |
| Data | How often evidence met its freshness target, and how many alerts were issued in a reduced, clearly labelled mode | Upstream data problems before they erode trust |
| Recommendation | How often each action is accepted, modified or rejected, and why | Which catalogue entries or effect estimates need revision |
| Outcome | Improvement compared with a comparison group, by contract version | Whether the intervention, rather than normal variation, moved the result |

The intervention paradox
Evaluating a predictive alerting system has a subtle trap. When an alert prompts a successful intervention, the predicted breach does not happen. Naively, that looks like a false positive. Conversely, a model that is never acted on can look well calibrated while delivering no value.
Handle this deliberately:
Governance runs through every stage described above. The NIST AI Risk Management Framework organises this work into four functions (Govern, Map, Measure and Manage) that map cleanly onto a decision-ready architecture. ISO/IEC 42001 provides a complementary management-system standard for organisations formalising AI governance.
| NIST AI RMF function | What it looks like in this architecture |
| Govern | Named owners for each decision contract, metric definition and action; change control for contracts and models; defined human approval tiers |
| Map | Each contract documents its context, affected stakeholders, permitted actions and known limitations before deployment |
| Measure | Calibration, precision, acceptance and outcome uplift tracked per contract version; degraded-mode and exception rates monitored |
| Manage | Thresholds, weights and actions adjusted on evidence; contracts retired when they stop adding value; incidents reviewed |
Several controls deserve explicit engineering attention:

None of this needs to be built at once. A staged approach delivers value early and builds the data needed for the later stages.
| Stage | Focus | Exit criteria |
| 1. Context | One decision contract; connected evidence; existing thresholds enriched with impact, owner and review point | Owners agree the briefing format is useful; freshness SLOs met |
| 2. Baselines and grouping | Calendar-aware baselines; persistence and hysteresis; one condition per decision | Alert volume per owner reduced; precision measured |
| 3. Prioritisation and recommendations | Tested breach forecasts; action catalogue; effect estimates; grounded narration | Acceptance rate tracked; no policy exceptions |
| 4. Closed-loop learning | Decision records; comparison-group evaluation; routine refinement | Outcome uplift estimated with a defensible method |
Several layers of this architecture depend on capabilities that are hard to build from scratch.
emite Advanced iPaaS connects contact centre and enterprise systems, handling the integration and alignment work that correlation depends on. Advanced Analytics provides consistent business measures and baselines, and Advanced Visualisation delivers role-based operational views.
AskEmite sits at the top of this architecture as the interface to the evidence. Its anomaly awareness, contextual explanations and suggested next steps draw on the same governed data, and the owner of each decision can interrogate that data in natural language rather than waiting for an analyst. Your data answers back.
Decision-ready intelligence is an engineering discipline. It starts with a contract that defines the decision, depends on correct event correlation and agreed definitions, uses baselines that reflect how the operation really behaves, ranks conditions by what timely action could avoid, recommends only what is feasible and permitted, and measures whether any of it helped.
The architecture is designed to support a measurable decision, with an accurate prediction as one of its components.
Examples and figures in this article are illustrative and are not product configuration or customer results. This article is not sponsored or endorsed by any organisation mentioned.


 Blog: From AI Insight to Meaningful Recommendations